16. Frequently Asked Questions
16.1. Why does Aurora use a lot of memory?
The short answer is: because it can.
The long answer is related to the way the go runtime manages the memory. There are many articles that describe the way how the garbage collector works but only a few that describe situations in which a program used a unexpectedly high amount of memory.
Note
It turns out that there was a change in Go 1.12 regarding how the runtime
signals the operating system that it can take unused memory. Before Go 1.12,
the runtime sends a MADV_DONTNEED signal on unused memory and the operating
system immediately reclaims the unused memory pages. Starting with Go 1.12,
the signal was changed to MADV_FREE, which tells the operating system
that it can reclaim some unused memory pages if it needs to, meaning it
doesn't always do that unless the system is under memory pressure from different processes.
So, yes, it is possible that the Aurora agent uses much more memory than the usual 200-300 MB, but only in cases in which there is a lot of free available memory. The operating system should be able to claim that excessive memory whenever needed.
If you notice that this is not the case, please provide a diagnostics pack, which also includes a complete memory profile of a running Aurora agent.
See the section Creating a Diagnostics Pack of the Aurora Agent Util chapter for details.
16.2. What's the impact of Sigma rule matching on the agent's performance?
Users are often interested in the matching process and ask questions like: "What's the performance impact with such a design? How scalable it is, let's say with 100 / 1000 / 10,000 sigma rules?"
The answer is that the impact isn't proportionate and thus much lower than expected. We use a matching logic that is very similar to the one used in i.e. YARA and therefore adding 1,000 rules to existing 1,000 rules would only slow down the agent by around 1-3%.
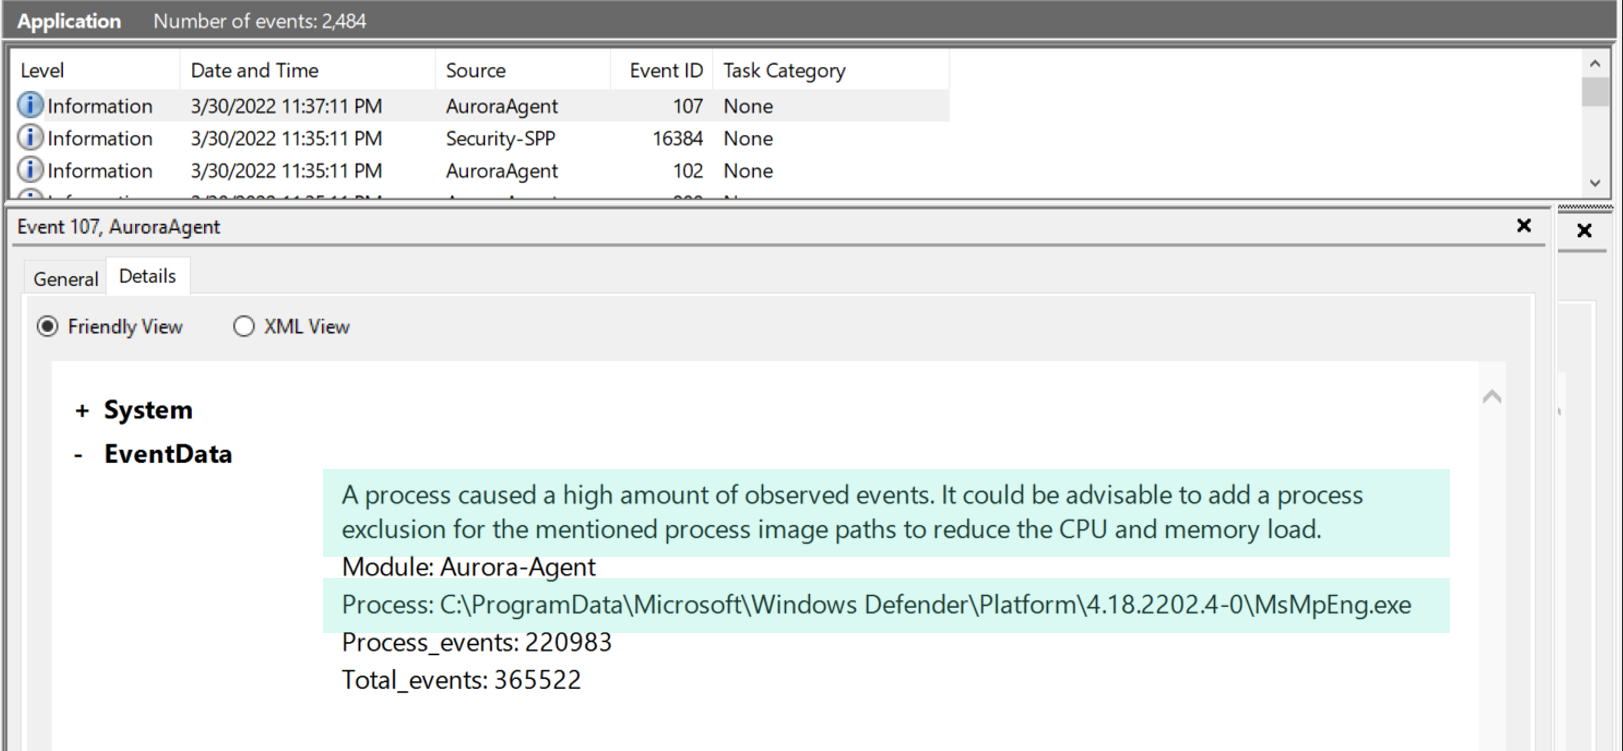
The most CPU cycles are spent on reading and parsing the events from the different ETW event channels. This means that a process that produces a disproportionately high number events in these channels causes much more impact than adding 1,000 or 10,000 sigma rules.
Aurora has some detection logic to detect and report such processes in separate log messages with ID 107. In the release version Aurora reports all processes that are responsible for more than 50% of the total number of events.
16.3. Why does Aurora Lite use the newest rules while Aurora doesn't?
The rules used by our commercial product go through an intensive internal testing process before we release them to our customers. The rule set used by Aurora includes the Github repository maintained by the Sigma community and Nextron's own private Sigma rules.
The tests include:
Sigma tests against EVTX files exported from 30+ different test systems
Live tests on 4+ Windows machines with simulated user activity
24h live endurance tests on 30+ different test systems
The Aurora Lite version always uses the current master of the
Github repository
maintained by the Sigma community. This set goes through some rudimentary
testing against exported EVTX files but isn't tested on live systems.
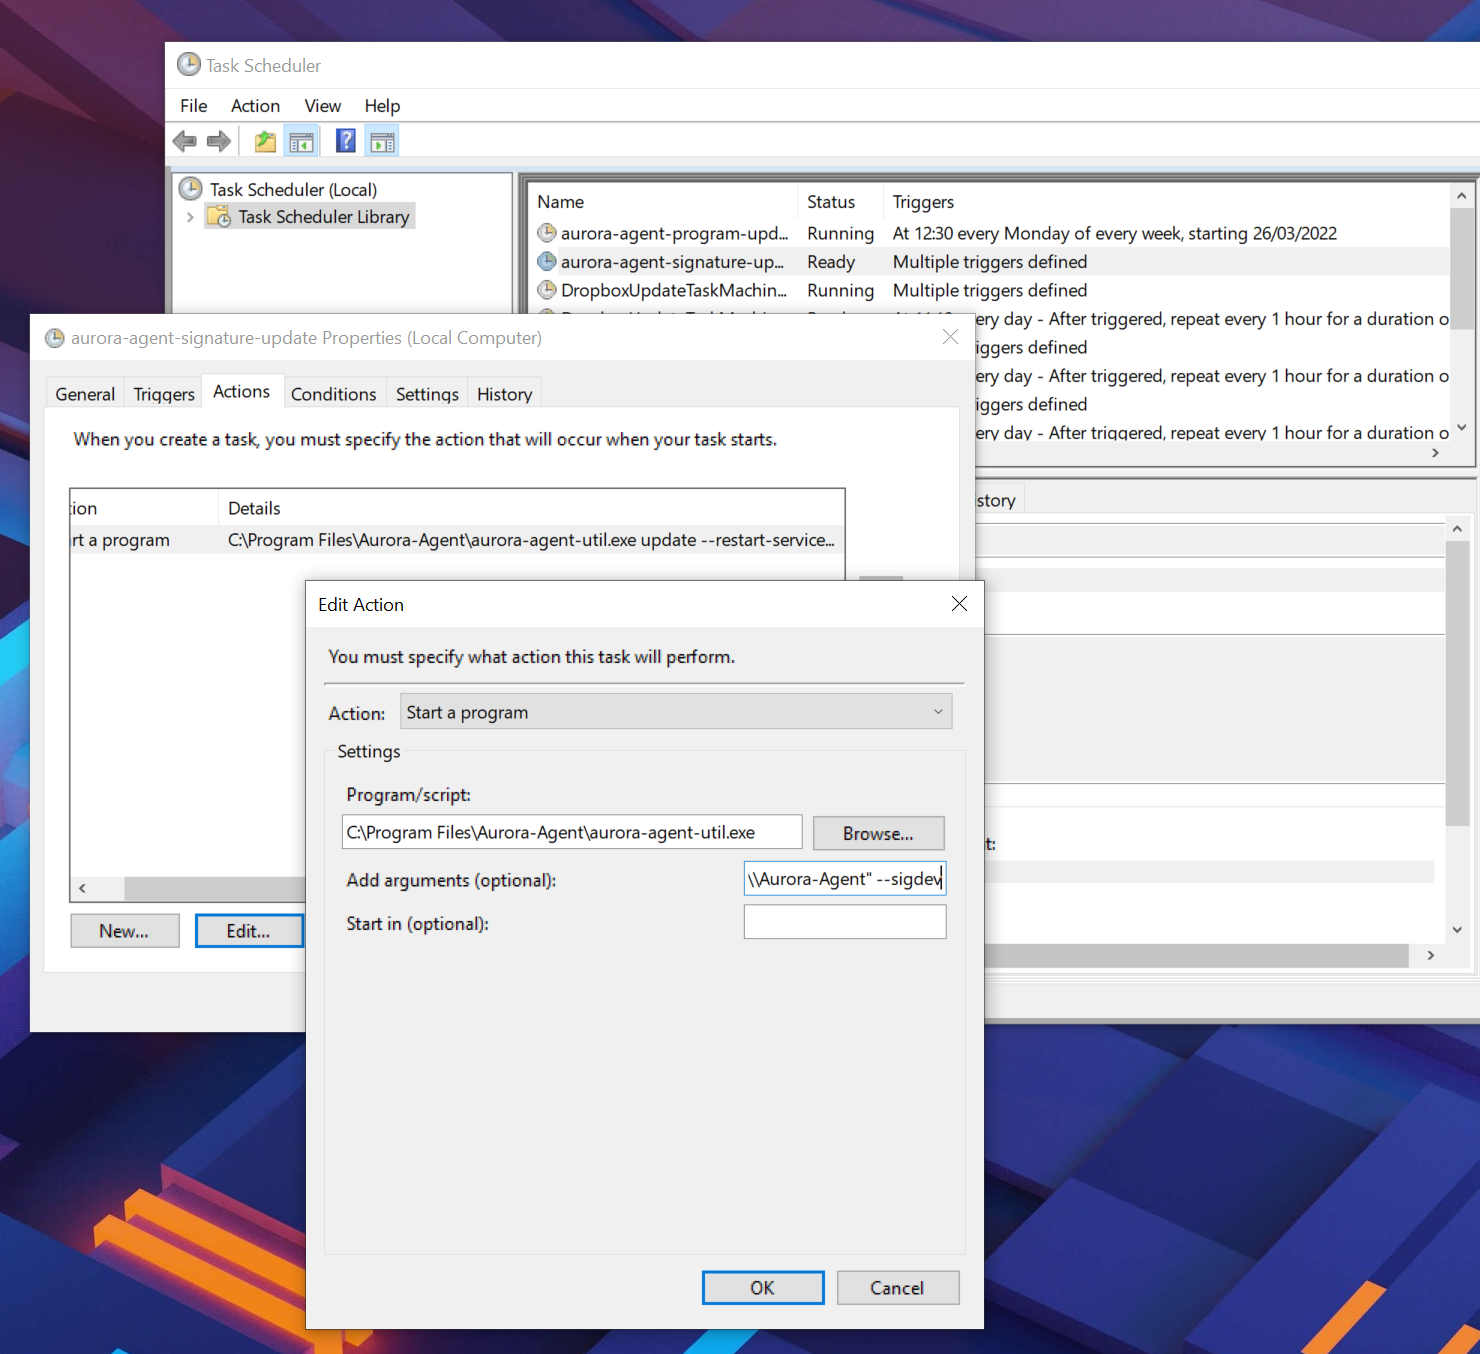
If you want to use the most current and untested rule set, you can add the
--sigdev flag to the command line flags used by the update tasks (add it
right after the update or upgrade command). Please be aware that
support cases caused by the use of that untested rule set may not be covered
by the existing maintenance or support contract.
16.4. Why does Aurora generate two alerts for a single event?
Aurora registers to different event channels that sometimes contain the same information. It is possible that Aurora notices the same activity in two different channels and generates two alerts for a single event.
In these cases, the alerts should have different values set in the Provider_Name
field, e.g. Provider_Name: Microsoft-Windows-Kernel-Process and Provider_Name: Microsoft-Windows-Sysmon.
It is unclear which of the two alerts should be suppressed in order to avoid these duplicate notifications, as they do not include identical information and in some situations one is preferred over the other or vice versa.
16.5. How do I view the suppressed Sigma matches?
In some messages, e.g. in the reported statistics (--report-stats) or the
status message (--status), you may find a number of suppressed Sigma matches
Event Statistics:
Events observed so far: 23483429
Events lost so far: 0
Sigma matches: 13
Suppressed Sigma matches of those: 6
Use the flag combination --status --trace to view which Sigma rule matches have been suppressed.
  1C:\Program Files\Aurora Agent>aurora-agent-64.exe --status --trace
  2Aurora Agent
  3Version: 0.9.9
  4Build Revision: 9280d44aef722
  5Signature Revision: 2022/03/25-161029
  6Sigma Revision: 0.20-3393-g952f14d8
  7Status: running
  8Uptime (in hours): 0
  9
 10Active Outputs:
 11Windows Application Eventlog: enabled
 12
 13Resource Usage:
 14CPU Cores: 2
 15Total Memory: 4.00GB
 16Used Memory: 2.65GB
 17Used by Aurora: 346.47MB
 18
 19Log Messages:
 20Errors: 0
 21Alerts: 0
 22Warnings: 6
 23Notices: 13
 24
 25Active Modules: LsassDumpDetector, BeaconHunter, EtwCanary, CommandLineMismatchDetector, ProcessTamperingDetector, TemporaryDriverLoadDetector, ApplyIOCs, Rescontrol, Sigma, ETWSource, ETWKernelSource, EventlogSource, PollHandles
 26
 27Rule Statistics:
 28Rule paths: C:\Program Files\Aurora-Agent\signatures\sigma-rules, C:\Program Files\Aurora-Agent\custom-signatures
 29Loaded rules: 1299
 30        custom: 2
 31        private: 18
 32        public: 1279
 33Rule reloads: 0
 34Responses: 0
 35Process dump path: C:\Program Files\Aurora-Agent\process-dumps
 36
 37Loaded IOCs:
 38Domain IOCs: 8425
 39        internal: 8425
 40Filename IOCs: 6894
 41        internal: 6894
 42Handle IOCs: 581
 43        internal: 581
 44Hash IOCs: 8448
 45        custom: 1
 46        internal: 8447
 47Namedpipe IOCs: 100
 48        internal: 100
 49
 50Event Statistics:
 51Events observed so far: 4003363
 52By source:
 53        1432318 events from PollHandles
 54        1108254 events from WinEventLog:Microsoft-Windows-Kernel-File/KERNEL_FILE_KEYWORD_CREATE
 55        872554 events from WinEventLog:Microsoft-Windows-Kernel-File/KERNEL_FILE_KEYWORD_FILEIO?eventids=14
 56        353165 events from WinEventLog:Microsoft-Windows-Sysmon/Operational
 57        162140 events from WinEventLog:Microsoft-Windows-Kernel-Audit-API-Calls
 58        30112 events from WinEventLog:Microsoft-Windows-Kernel-Process/WINEVENT_KEYWORD_IMAGE
 59        15275 events from WinEventLog:Microsoft-Windows-Kernel-Process/WINEVENT_KEYWORD_THREAD
 60        8113 events from WinEventLog:Microsoft-Windows-Kernel-File/KERNEL_FILE_KEYWORD_DELETE_PATH
 61        4738 events from WinEventLog:Microsoft-Windows-Kernel-File/KERNEL_FILE_KEYWORD_CREATE_NEW_FILE
 62        4717 events from WinEventLog:Microsoft-Windows-Kernel-File/KERNEL_FILE_KEYWORD_RENAME_SETLINK_PATH
 63        3826 events from WinEventLog:Microsoft-Windows-DNS-Client
 64        3558 events from WinEventLog:Microsoft-Windows-TCPIP/ut:ConnectPath
 65        1302 events from SystemLogger:Process
 66        1236 events from WinEventLog:Security
 67        756 events from WinEventLog:Microsoft-Windows-TaskScheduler/Operational
 68        639 events from WinEventLog:Microsoft-Windows-Kernel-Process/WINEVENT_KEYWORD_PROCESS
 69        257 events from WinEventLog:Microsoft-Windows-WinINet/WININET_KEYWORD_HANDLES
 70        127 events from WinEventLog:{fbb4fbaa-2ae9-5b86-6d76-09930a11a03d}?fromownpid=1
 71        120 events from WinEventLog:System
 72        57 events from WinEventLog:Microsoft-Windows-Windows Firewall With Advanced Security/Firewall
 73        27 events from WinEventLog:Microsoft-Windows-WMI-Activity/Operational
 74        25 events from WinEventLog:Microsoft-Windows-PowerShell
 75        23 events from WinEventLog:Application
 76        8 events from WinEventLog:Windows PowerShell
 77        6 events from WinEventLog:Microsoft-Windows-Kernel-PnP/DriverLoad
 78        5 events from WinEventLog:Microsoft-Windows-Windows Defender/Operational
 79        4 events from WinEventLog:Microsoft-Windows-Kernel-PnP/DriverUnload
 80        1 events from WinEventLog:Microsoft-Windows-SmbClient/Security
 81By process:
 82        1146976 events from C:\Windows\System32\svchost.exe
 83        875516 events from C:\ProgramData\Microsoft\Windows Defender\Platform\4.18.2202.4-0\MsMpEng.exe
 84        519059 events from C:\Windows\Sysmon64.exe
 85        142271 events from C:\Windows\System32\RuntimeBroker.exe
 86        110926 events from C:\Windows\explorer.exe
 87        108878 events from System
 88        99896 events from C:\Users\neo\Downloads\ProcessExplorer\procexp64.exe
 89        77899 events from C:\Users\neo\AppData\Local\Programs\Microsoft VS Code\Code.exe
 90        64256 events from C:\aurora-beta\aurora-agent-util.exe
 91        ...
 92
 93False positive filters: 0
 94Process excludes: 0
 95
 96Events missed so far: 0
 97Sigma matches: 28
 98Whoami Execution: 12
 99Run Whoami Showing Privileges: 9
100Suspicious WSMAN Provider Image Loads: 4
101New TaskCache Entry: 2
102Run Once Task Configuration in Registry: 1
103Suppressed Sigma matches of those: 9
104Whoami Execution: 6
105Run Whoami Showing Privileges: 3
106
107Response Actions: disabled
The match throttling can be configured with the flags --match-burst and
--match-throttling. We recommend keeping the default. It does not suppress
matches of a rule that you haven't already noticed in the defined time frame
(each rule triggers at least --match-burst number of times before being throttled).
It only throttles numerous matches of a single rule; cases in which a single rule
causes numerous matches in the defined time frame, which is typically the cause
of a noisy / too sensitive rule.
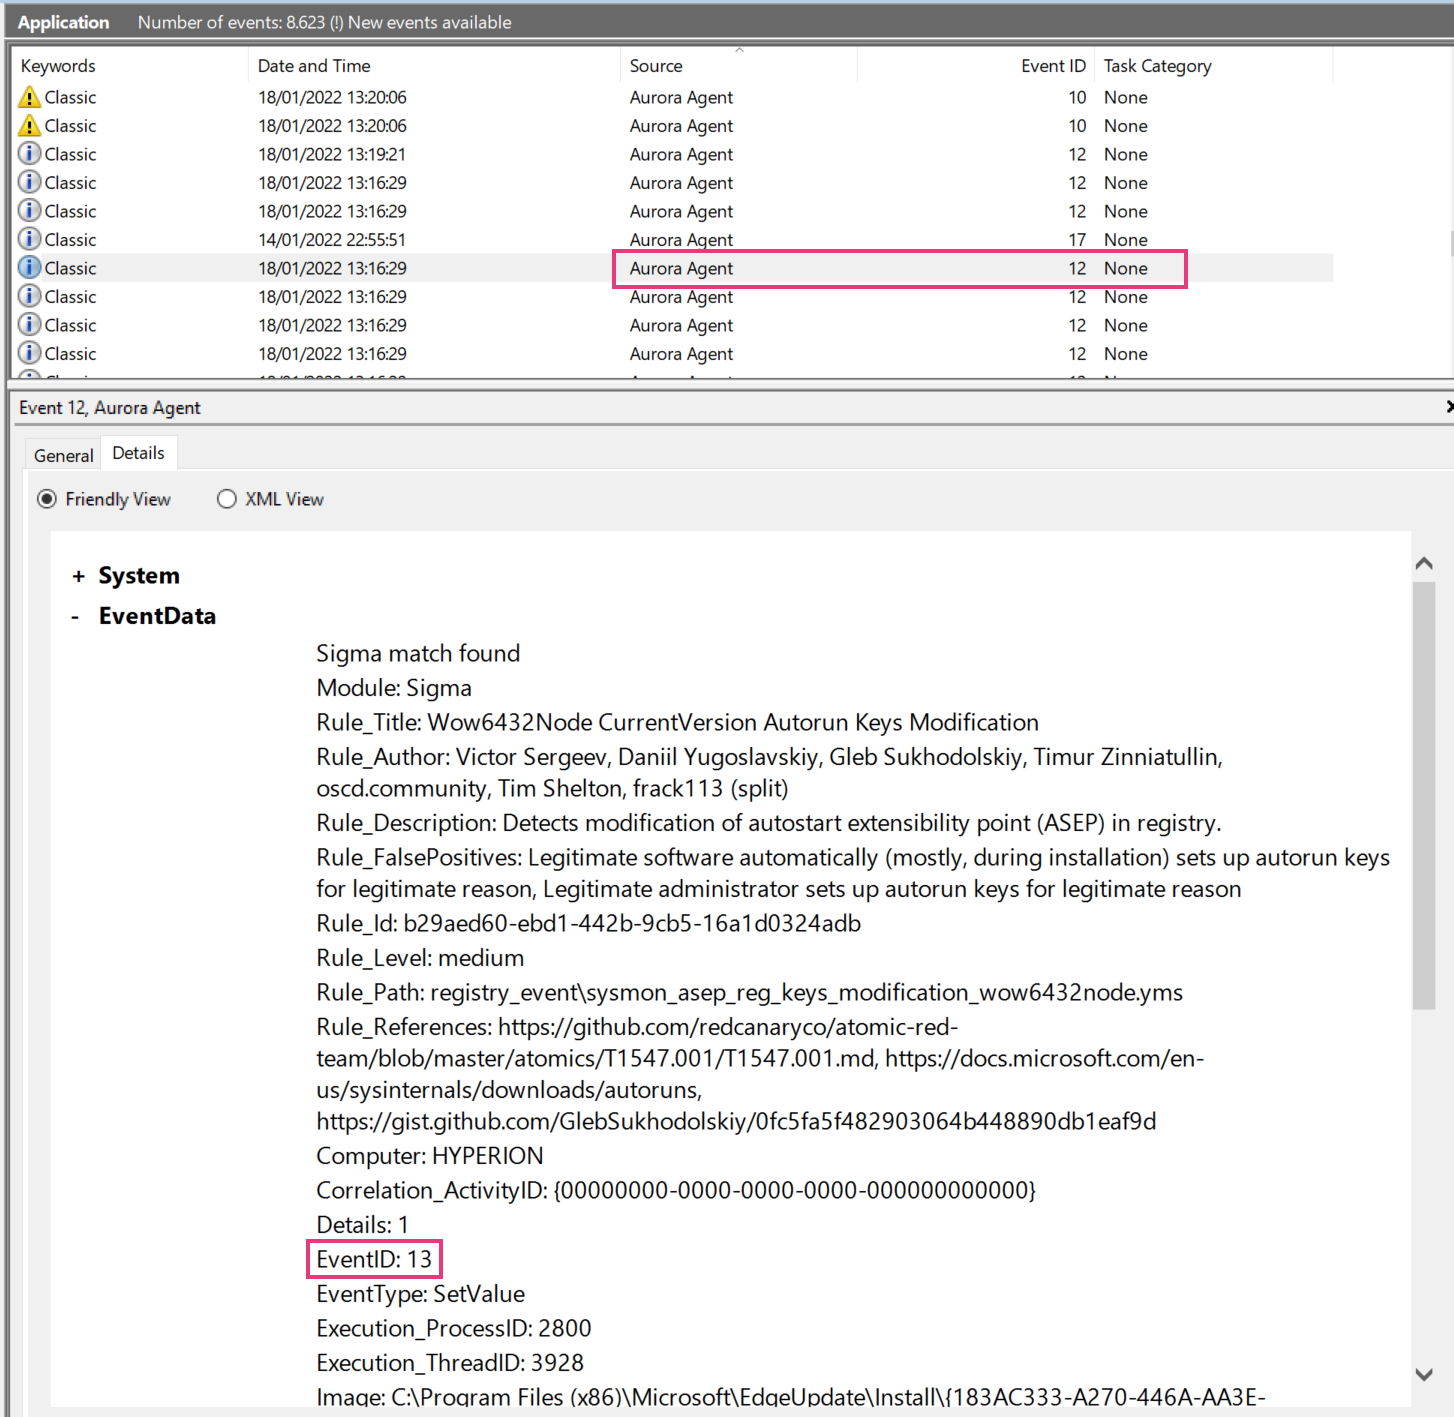
16.6. Why does the Event ID in the Windows Eventlog differ from the one in the Event Data?
There's a difference between the Event IDs in the source channels and the Event IDs that we use to write into the various output channels.
The Event ID that you find in the event data is the one provided in the ETW channel that Aurora subscribes to. The Event ID used to write these events into the local Windows Eventlog differ from these Event IDs and are controlled by Aurora.
16.7. Why does Aurora take so long to start?
Almost all of the startup time comes from loading and compiling the IOCs and
Sigma rules. --debug gives more information on what Aurora is doing during startup.
If you don't need all IOCs and Sigma rules, it can be helpful to use --deactivate-module,
--ioc-path and --rules-path to significantly reduce the startup time:
--deactivate-module ApplyIOCs --rules-path my-custom-rule.ymldeactivates IOCs completely and only loads the specified sigma rule.--deactivate-module Sigma --ioc-path my-custom-filename-ioc.txtdeactivates Sigma rules completely and only loads the specified filename IOC file.
16.8. Why doesn't Aurora report Registry matches?
The reason is that ETW provides only insufficient data in the respective event channels. Aurora has to perform some resource intensive check whenever processes access the Windows registry. We have therefore activated these checks only in the "intense" preset.
See chapter Detection Gaps for more details.